Introduction

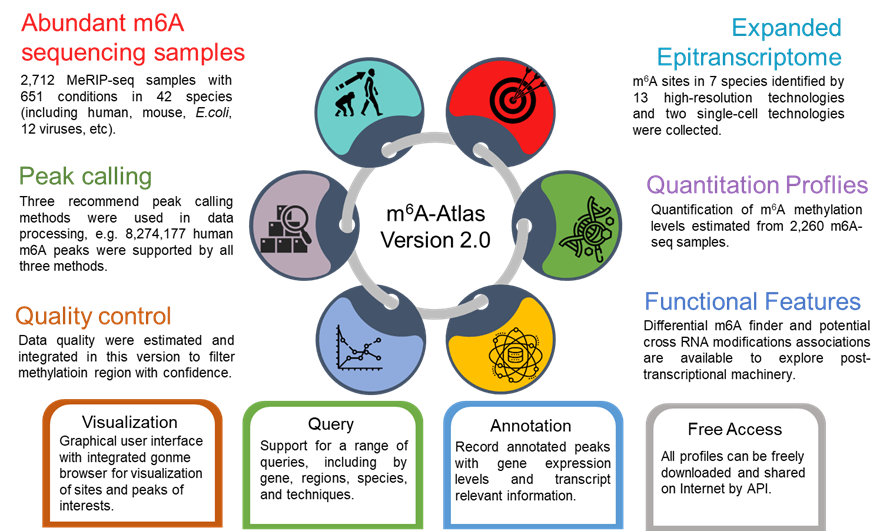
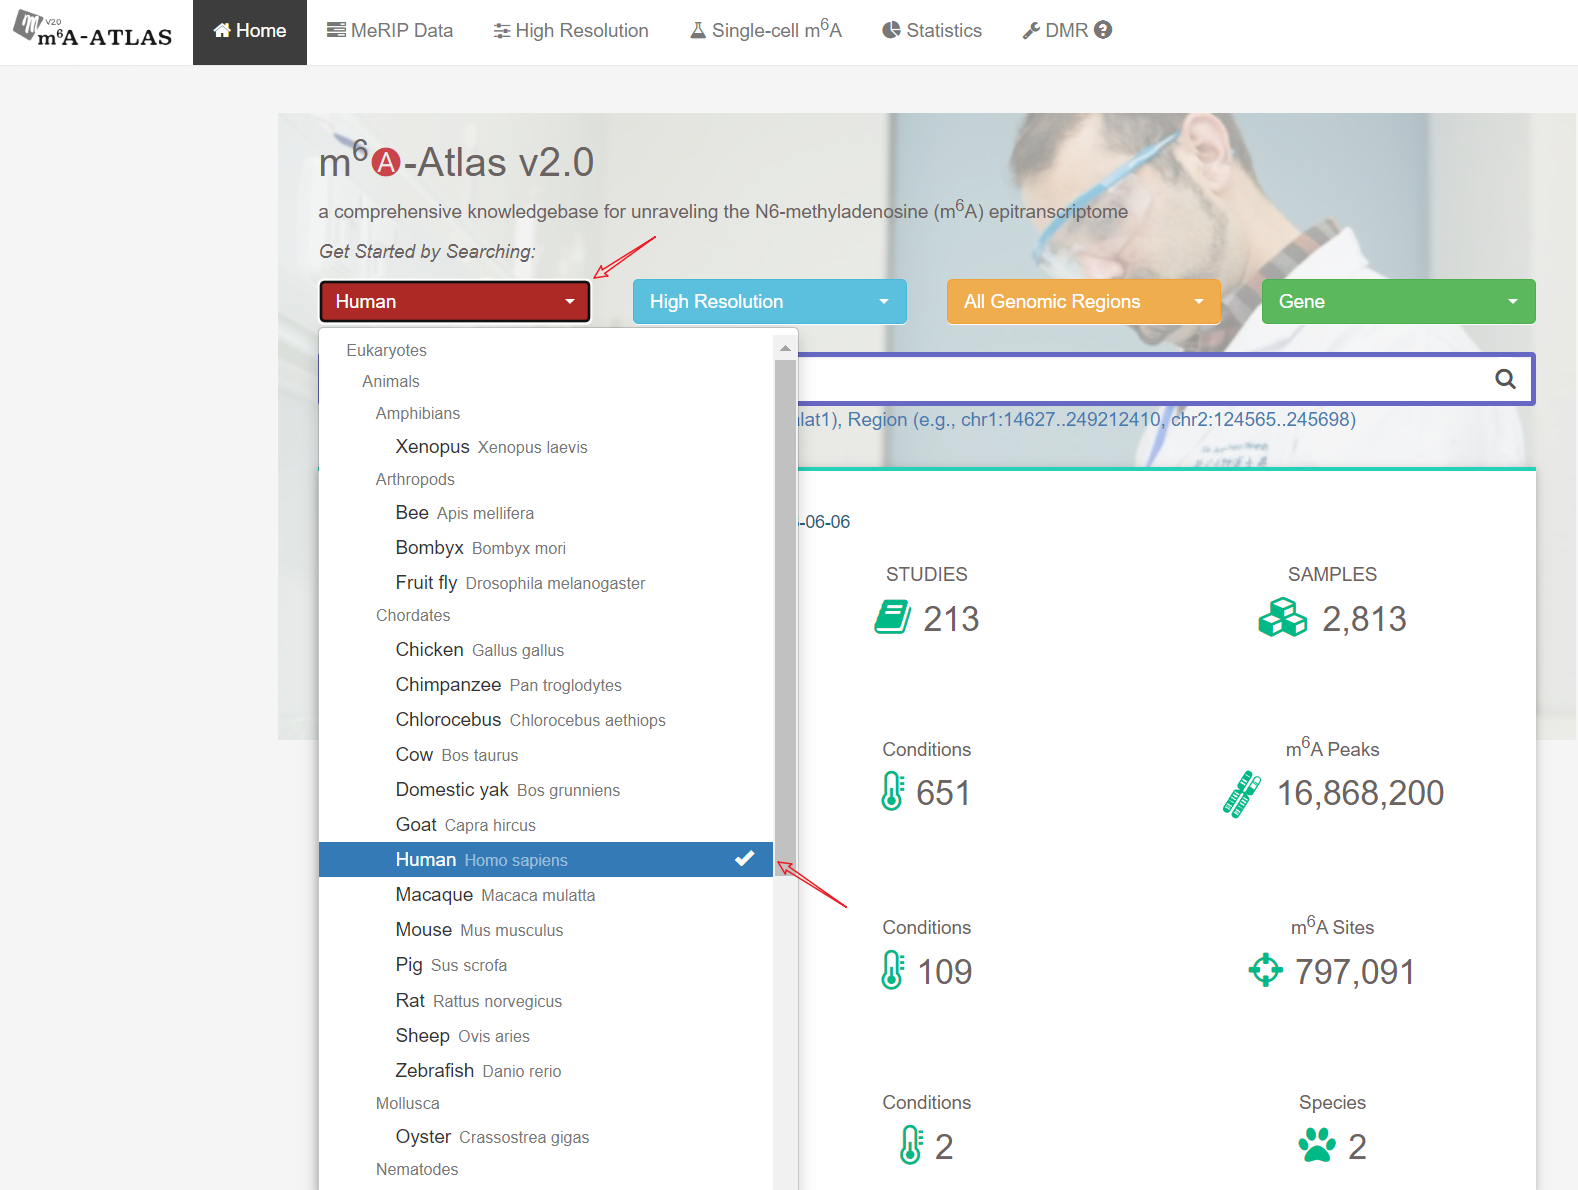
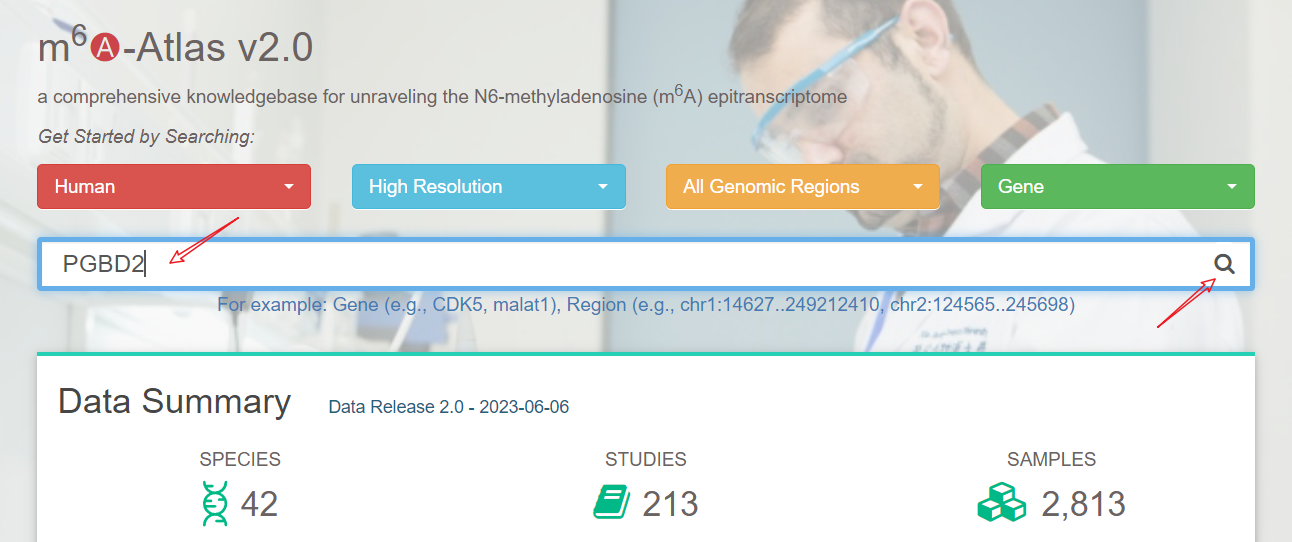
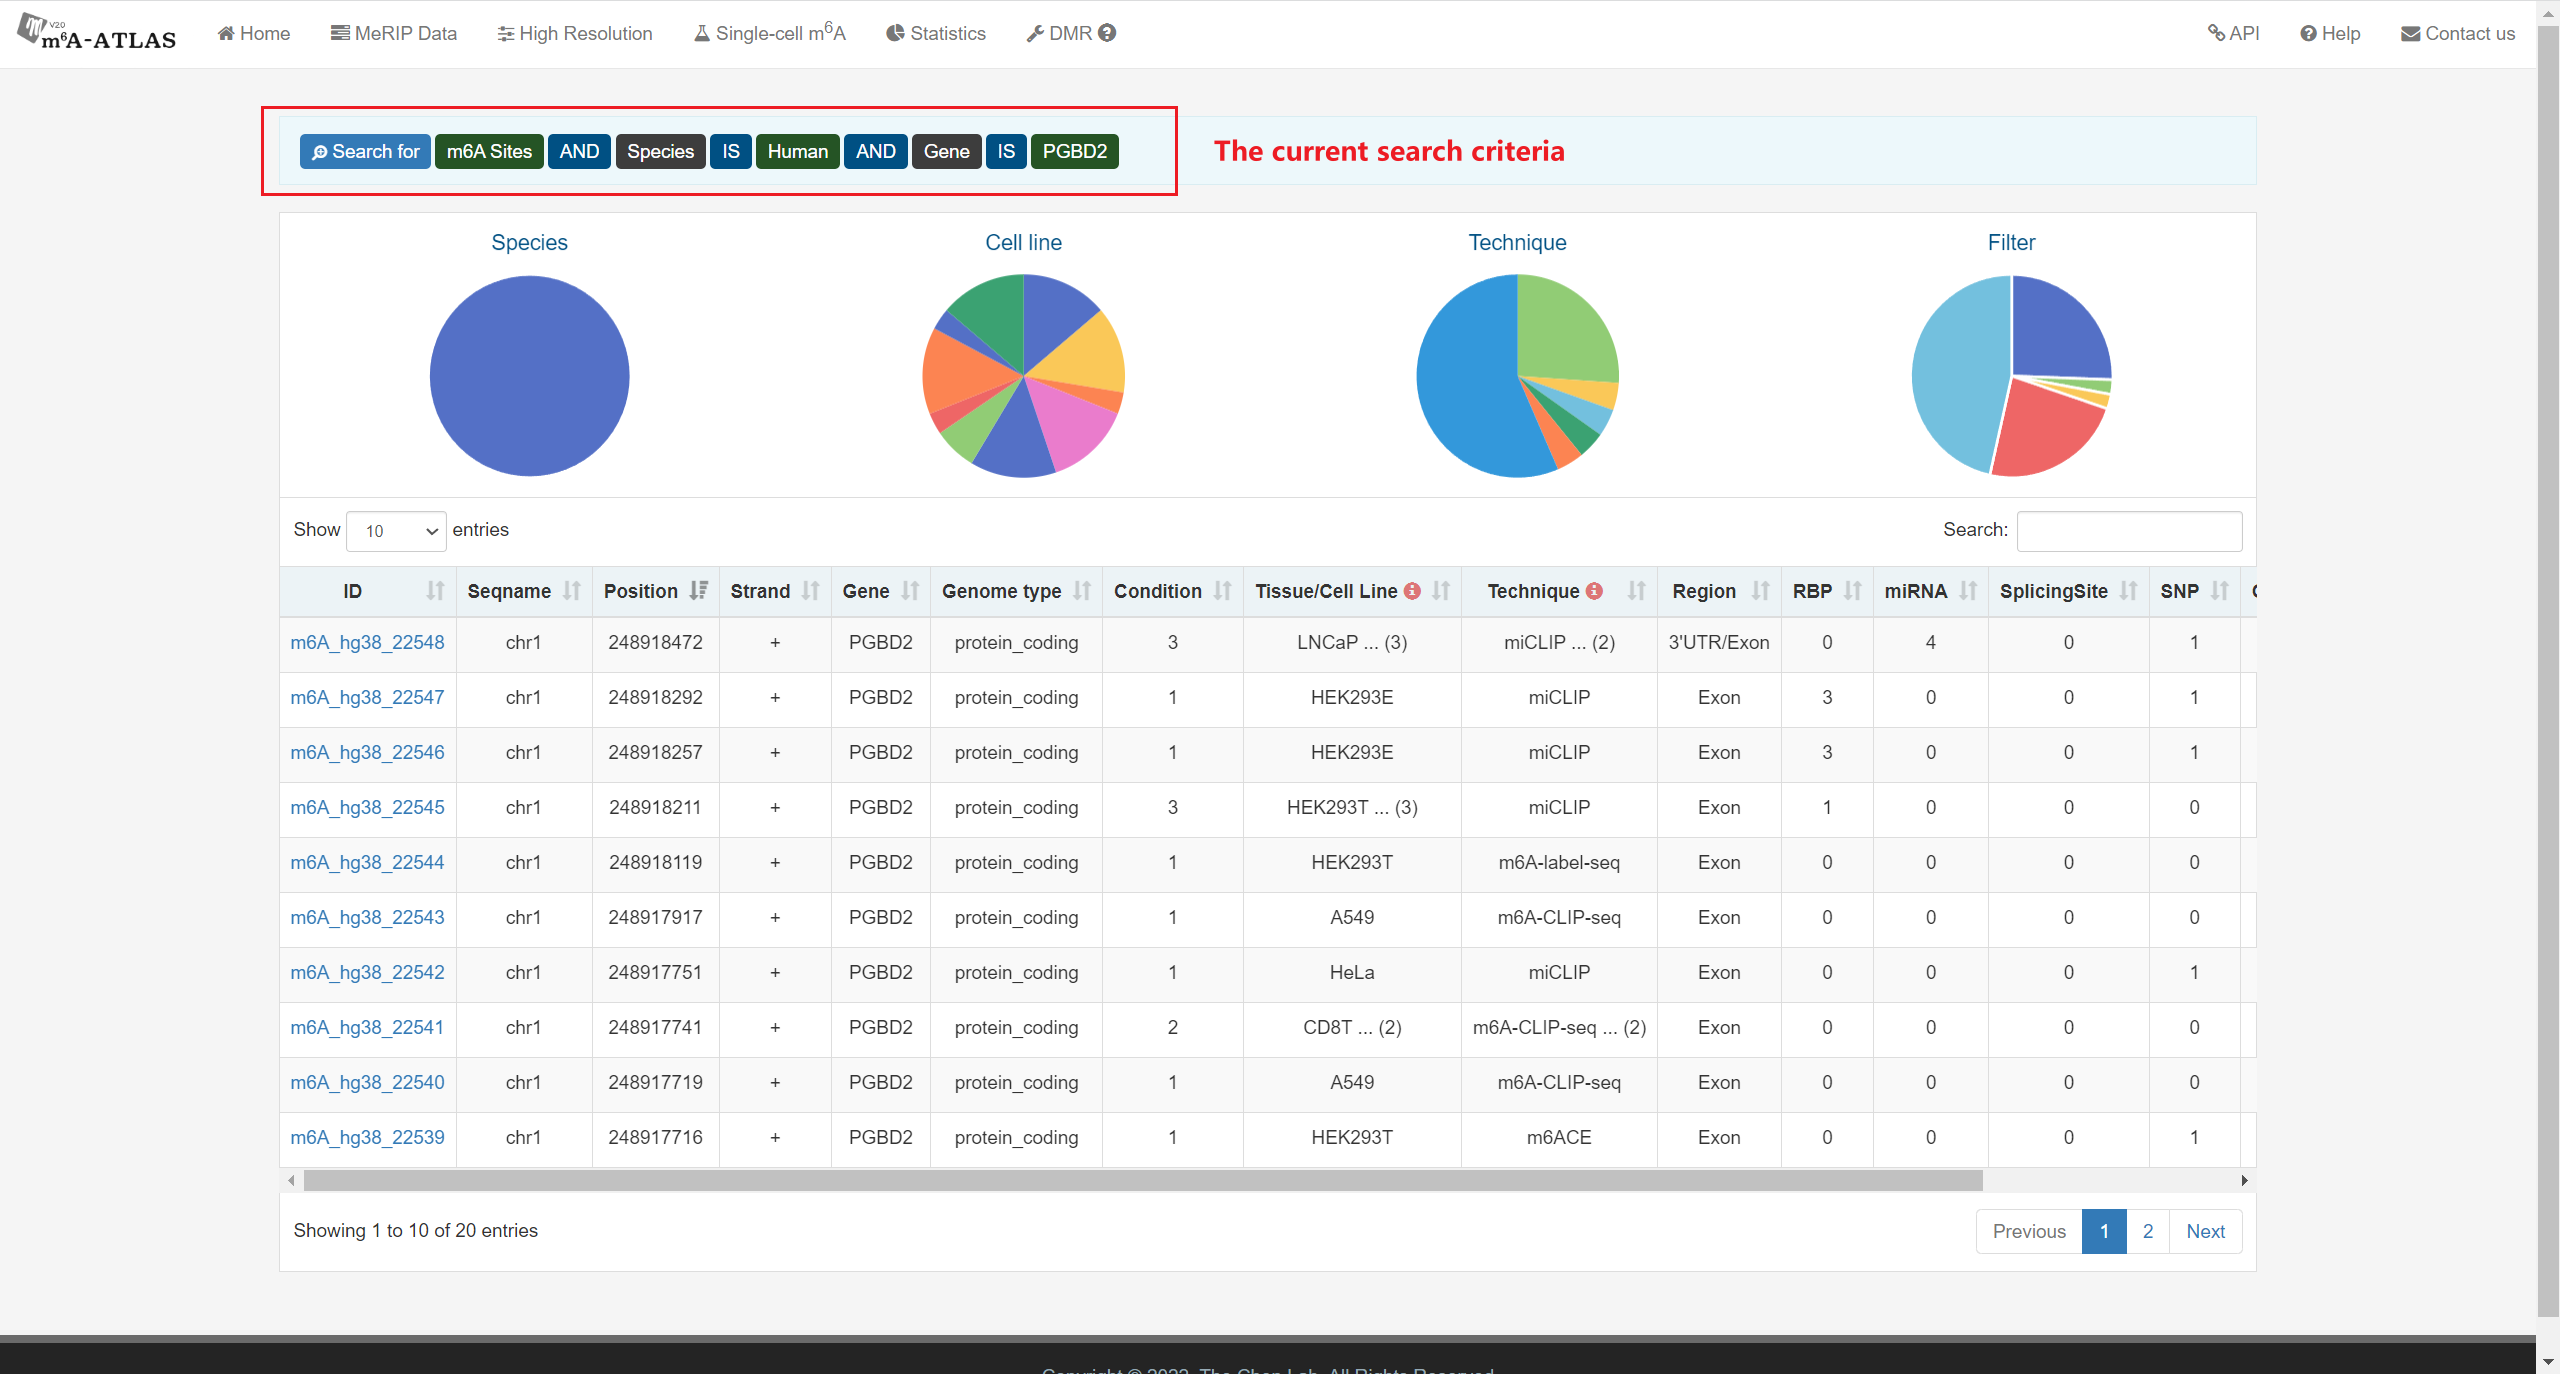
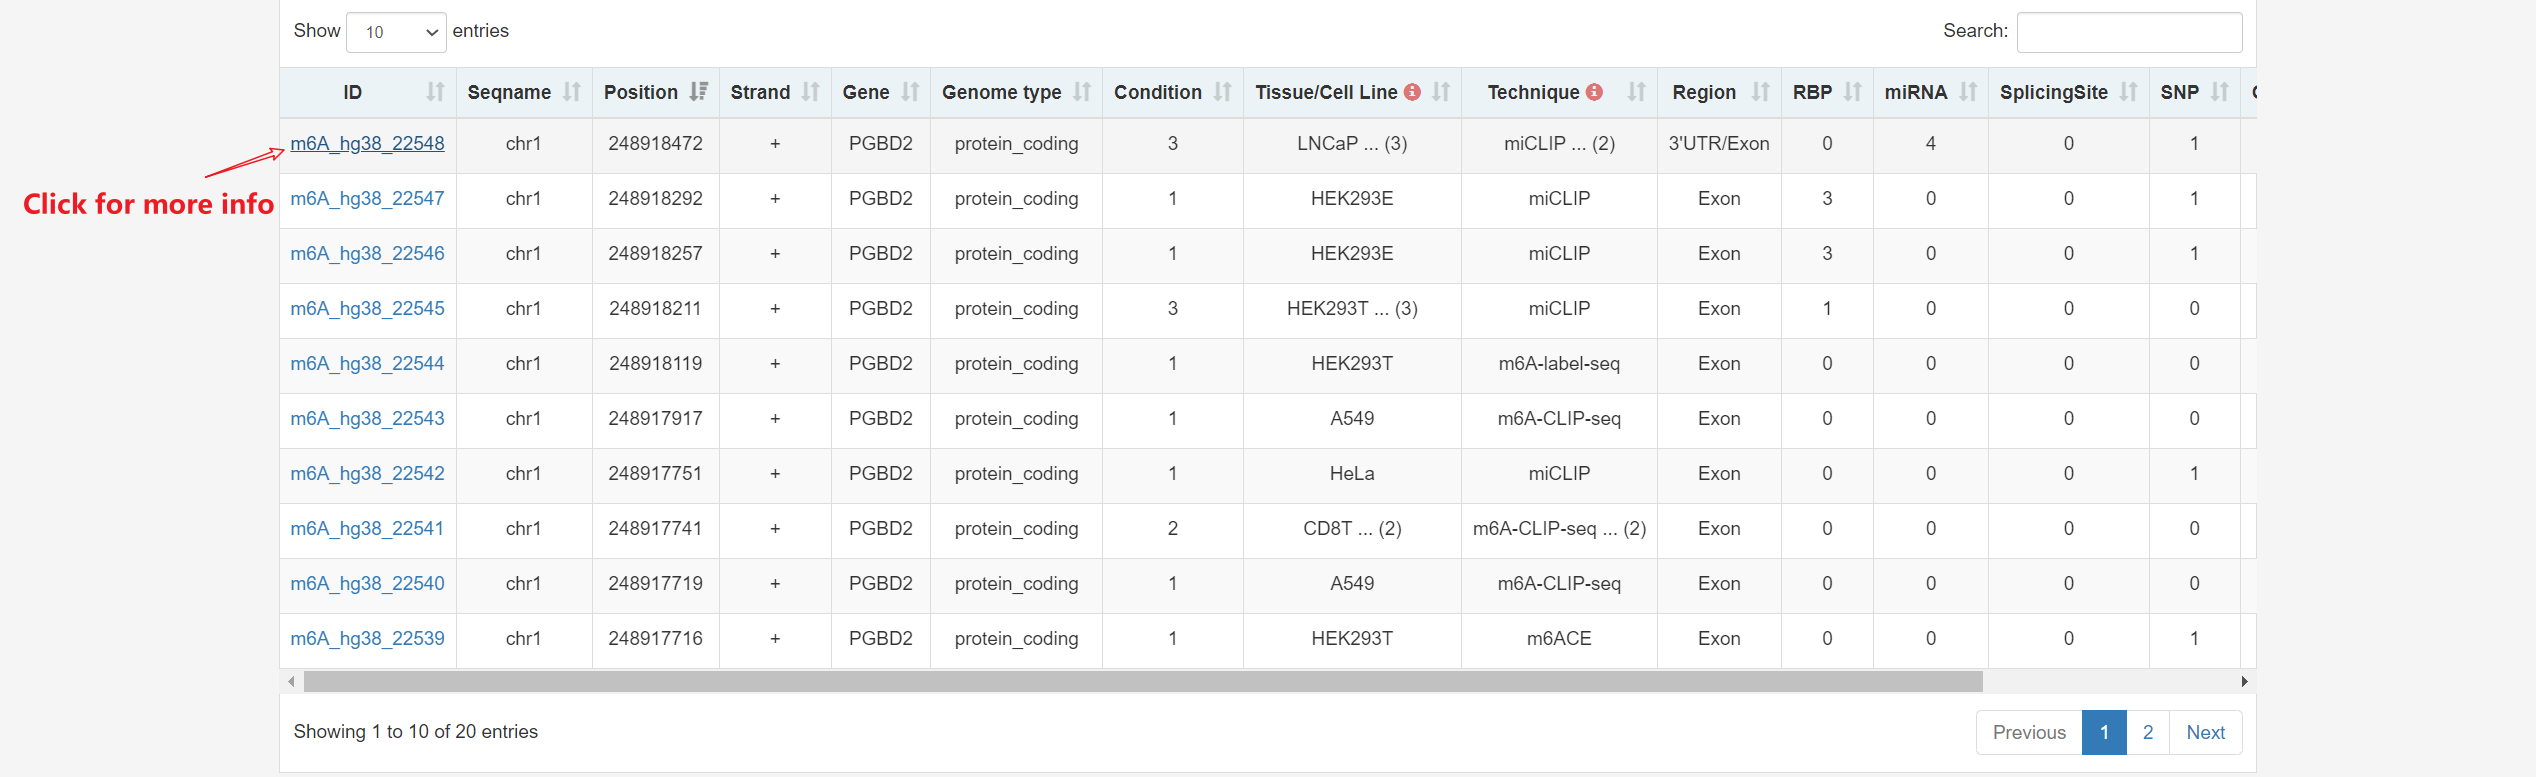
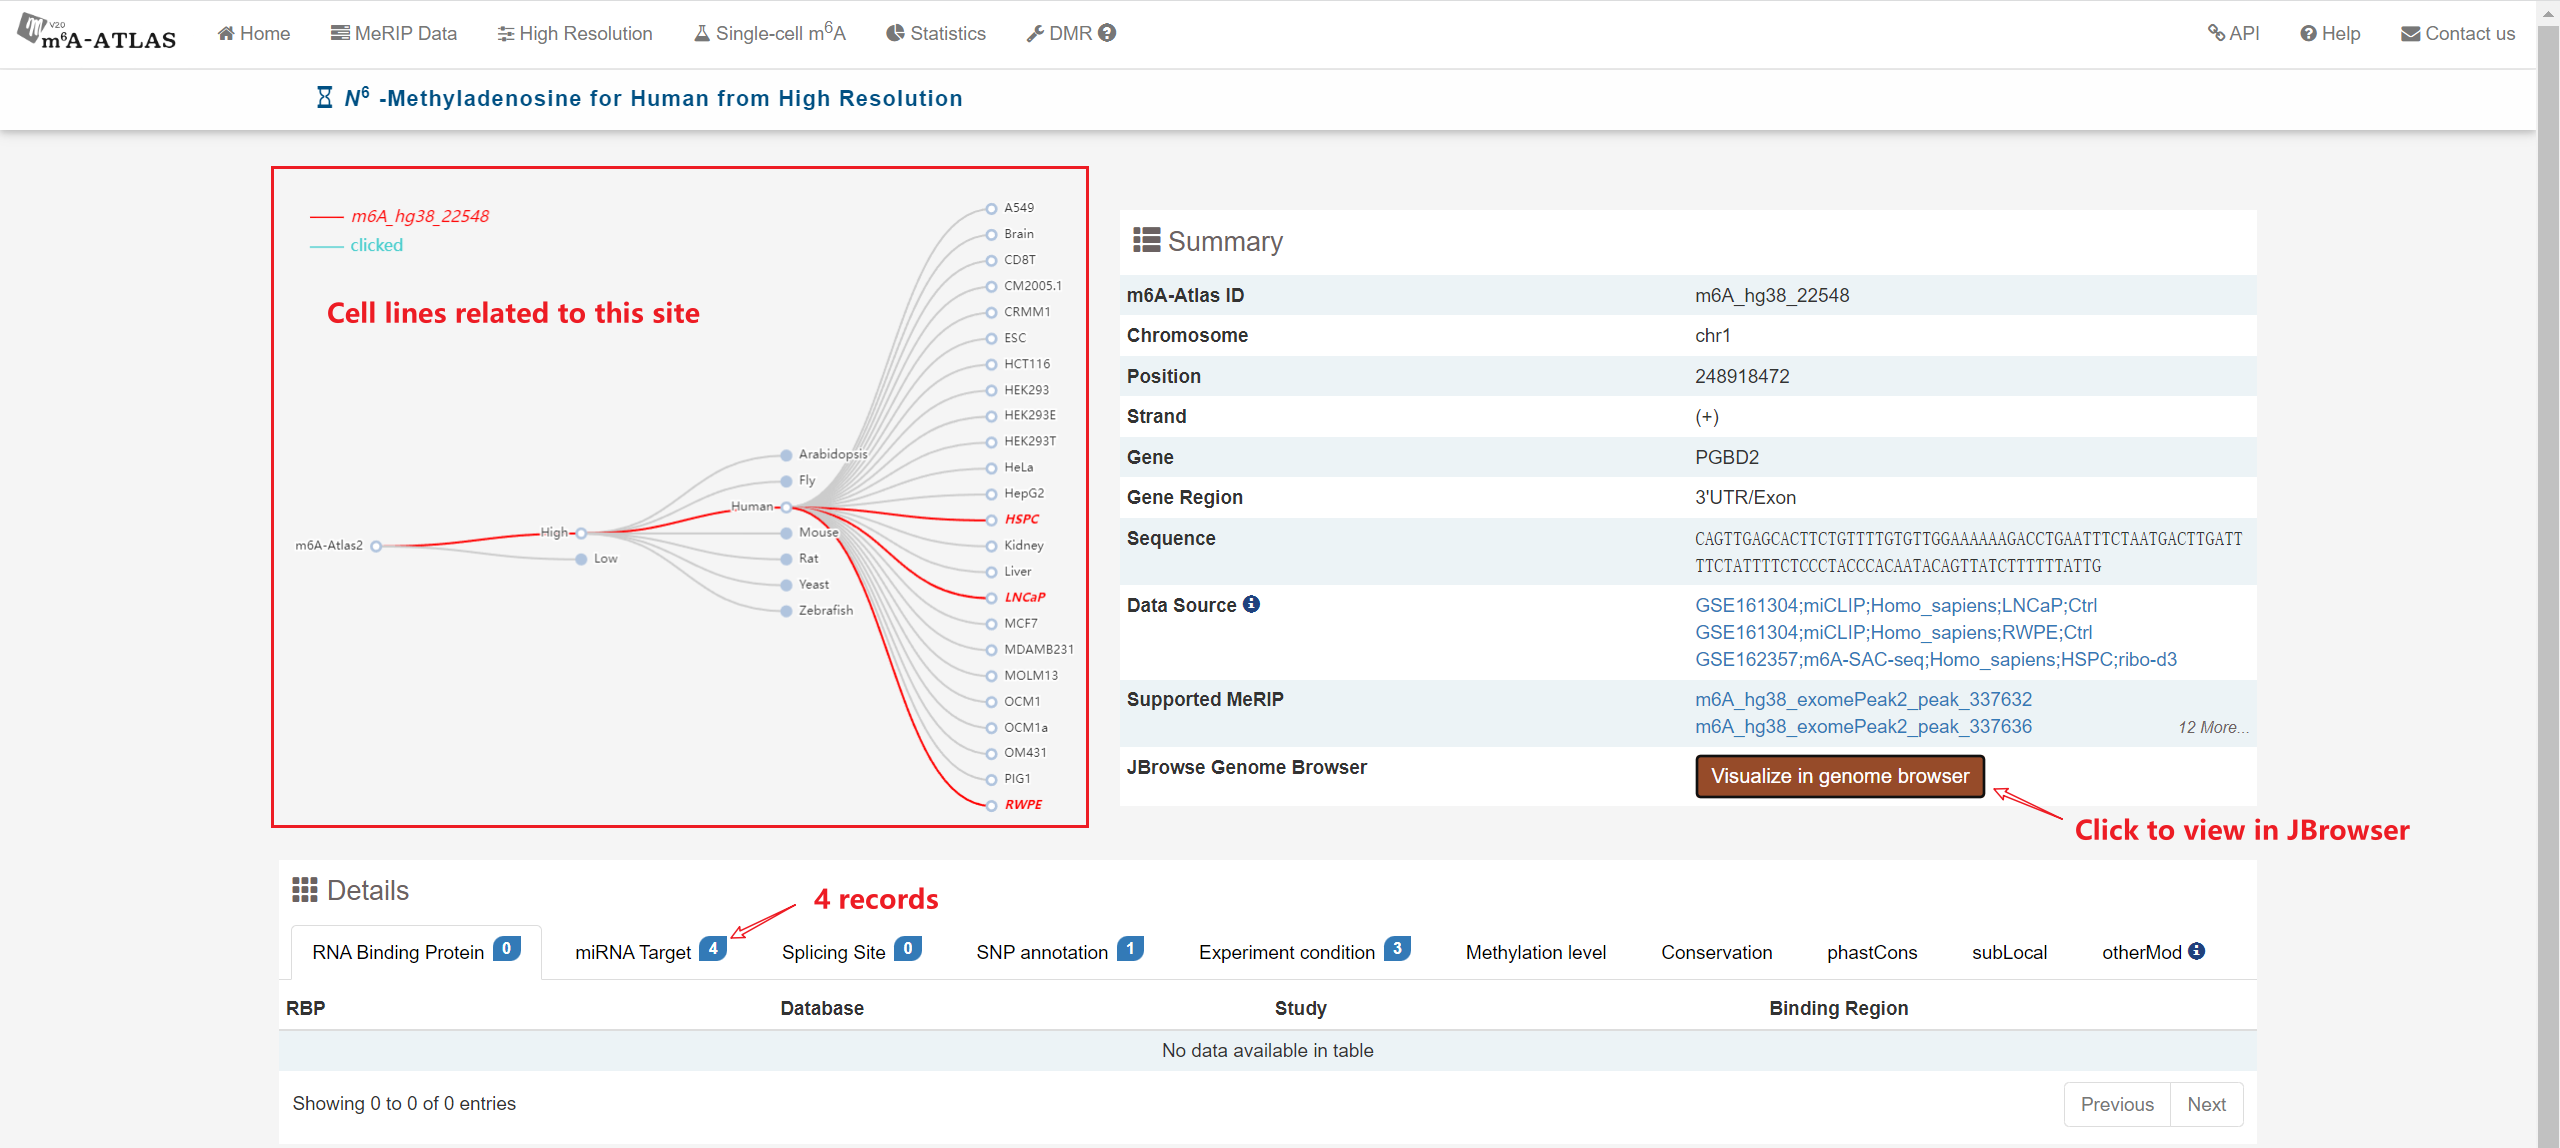
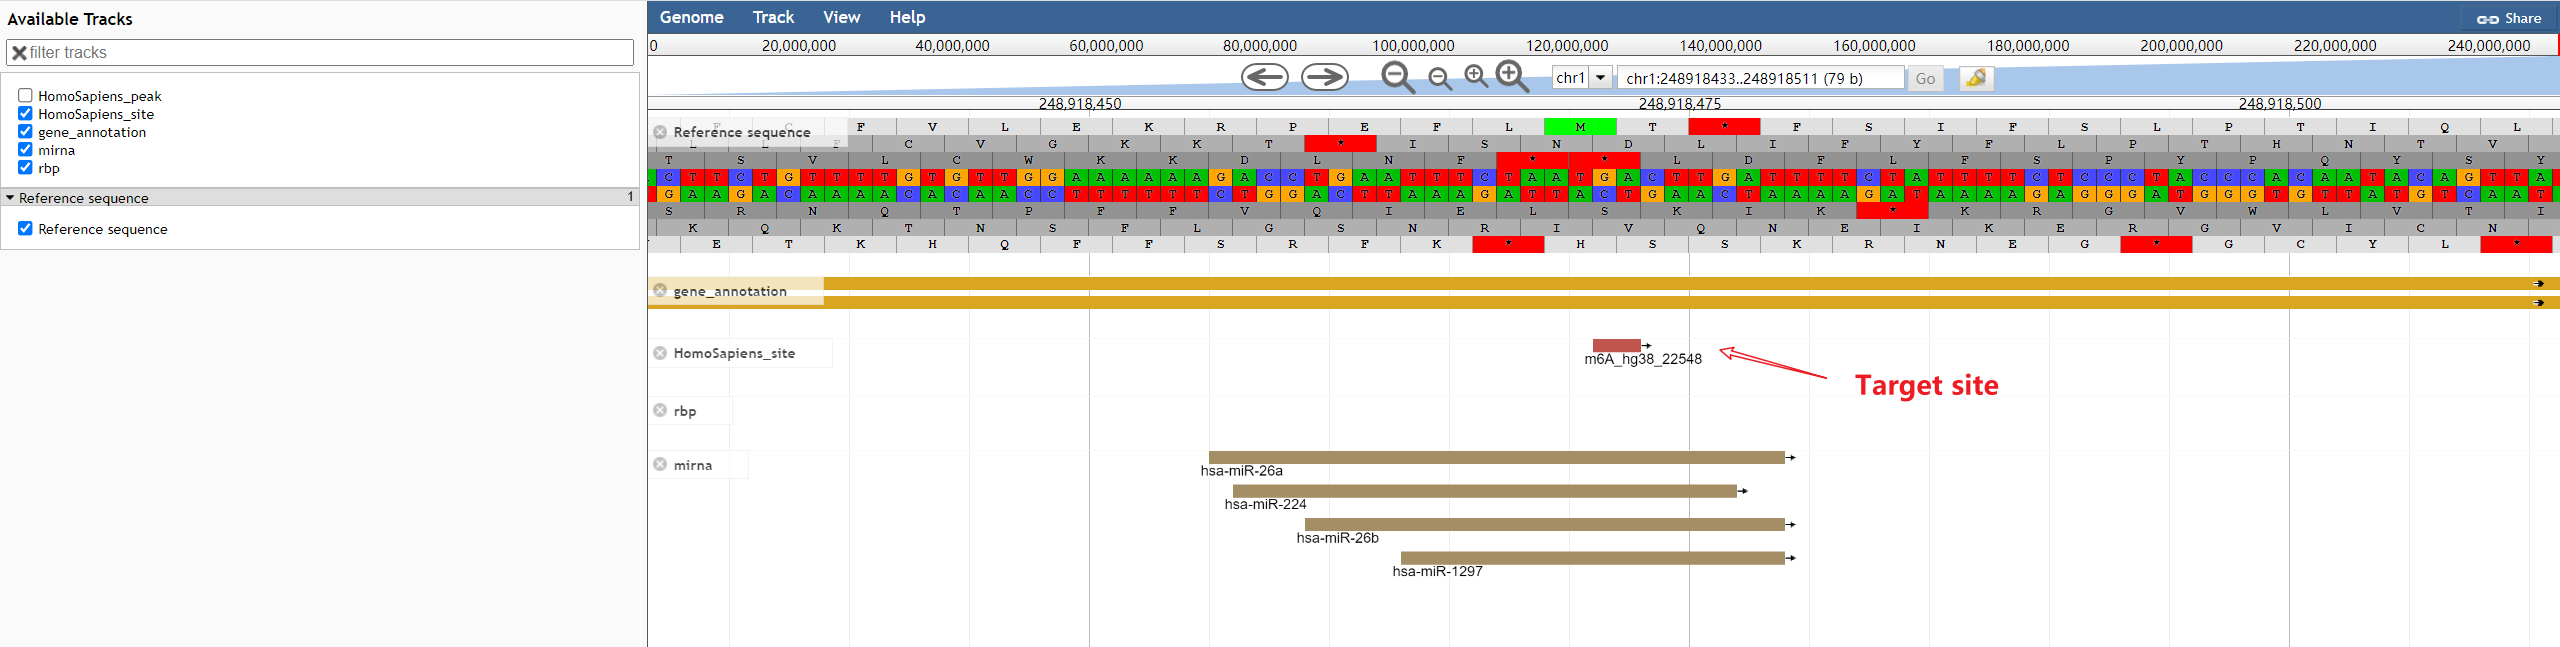
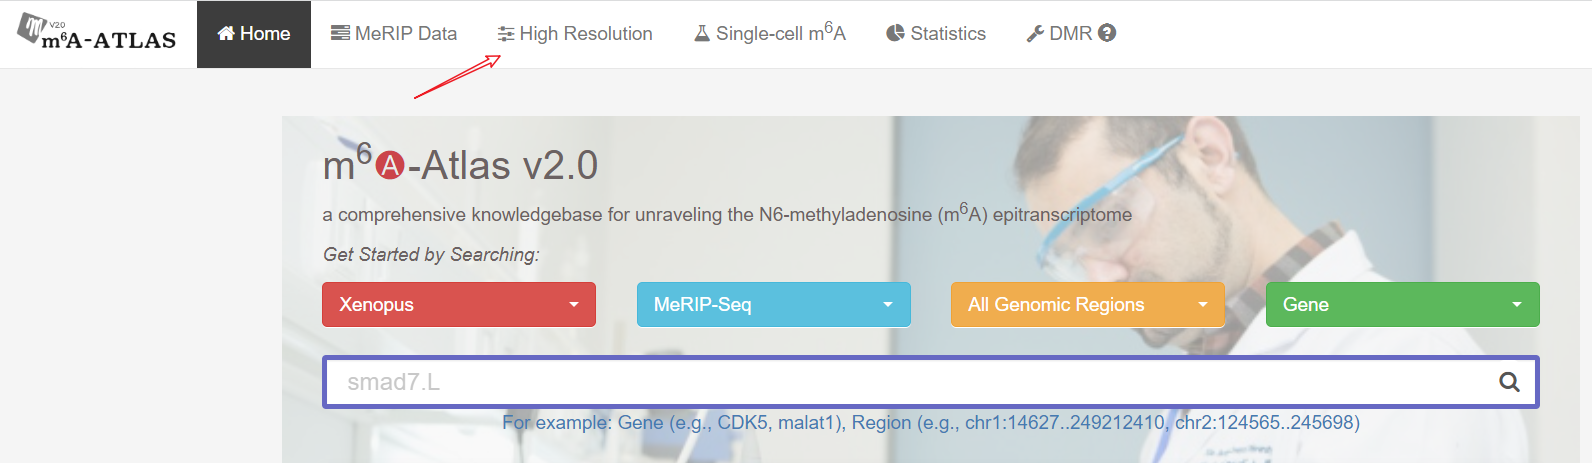
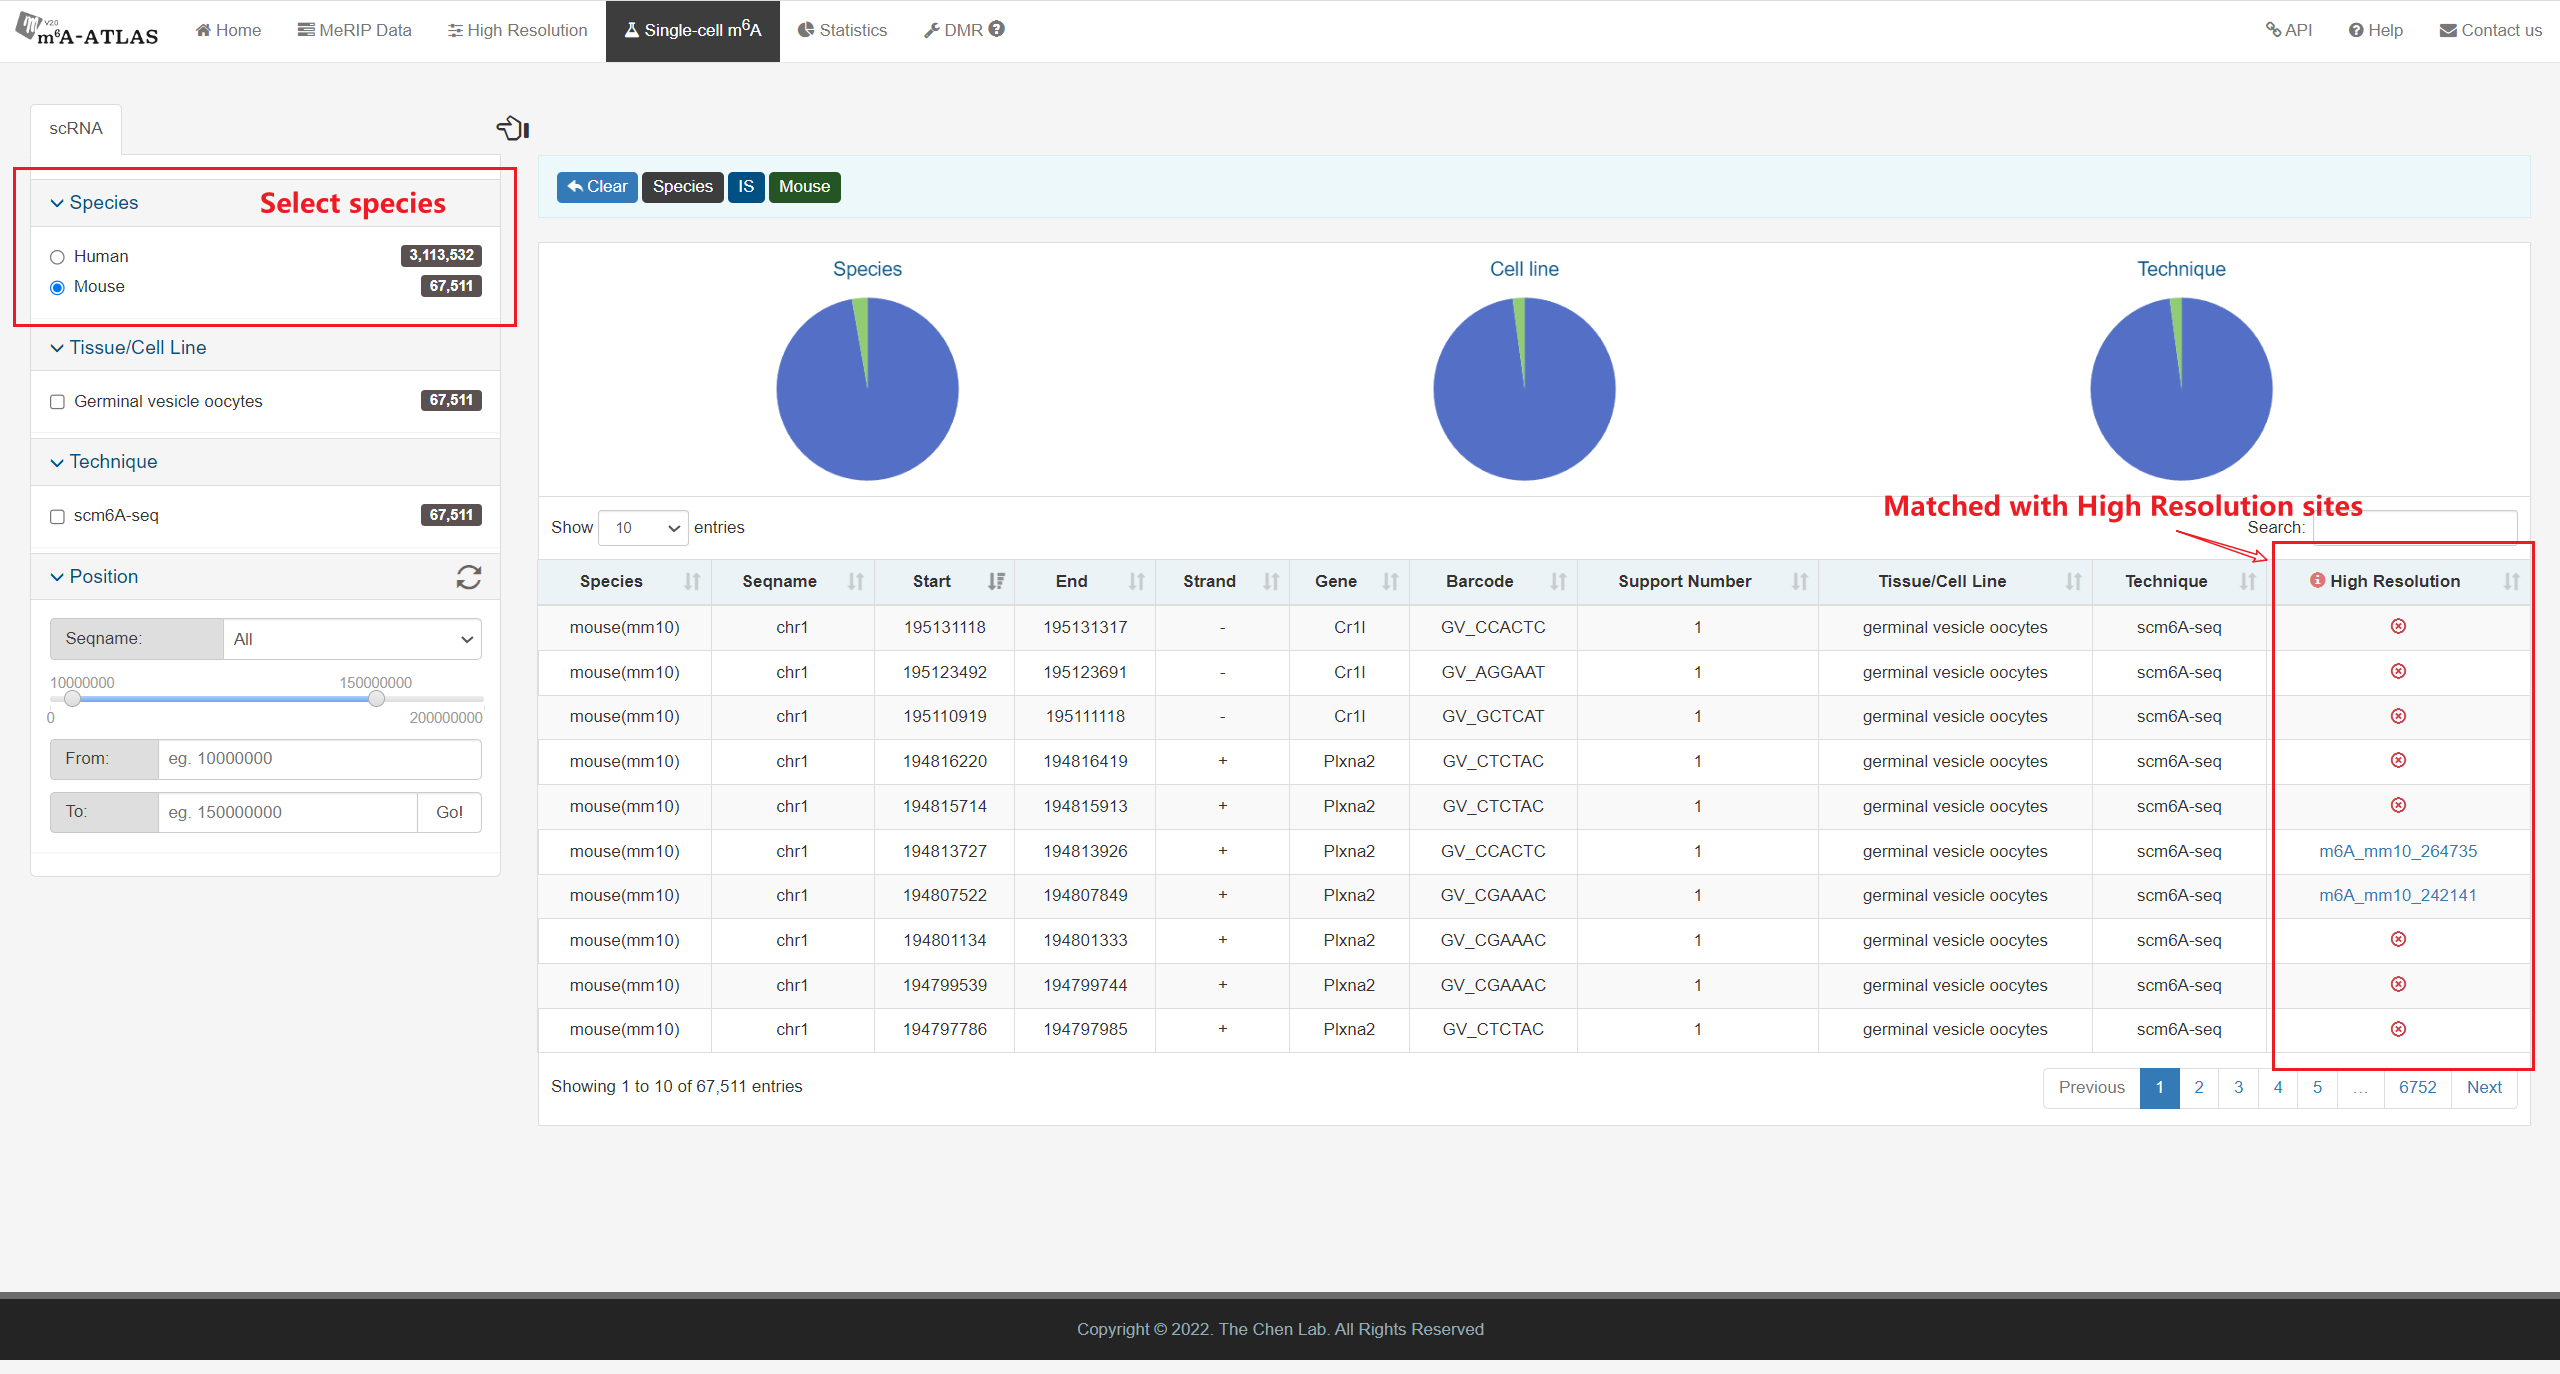
m6A-Atlas v2.0 was expanded to include 797,091 reliable m6A sites among 7 species, with 13 high-resolution technologies and 109 conditions. Additionally, sites derived from single-cell technique were presented for the first time. It estimated quantitative epitranscriptome profiles under 241 conditions for human and 129 conditions for mouse. A user-friendly graphical interface was constructed to support the query, exploration and sharing of the m6A epitranscriptomes annotated with putative post-transcriptional machinery (SNP association, conservation, RBP-binding, microRNA interaction, splicing sites, subcellular location and circRNA generation).


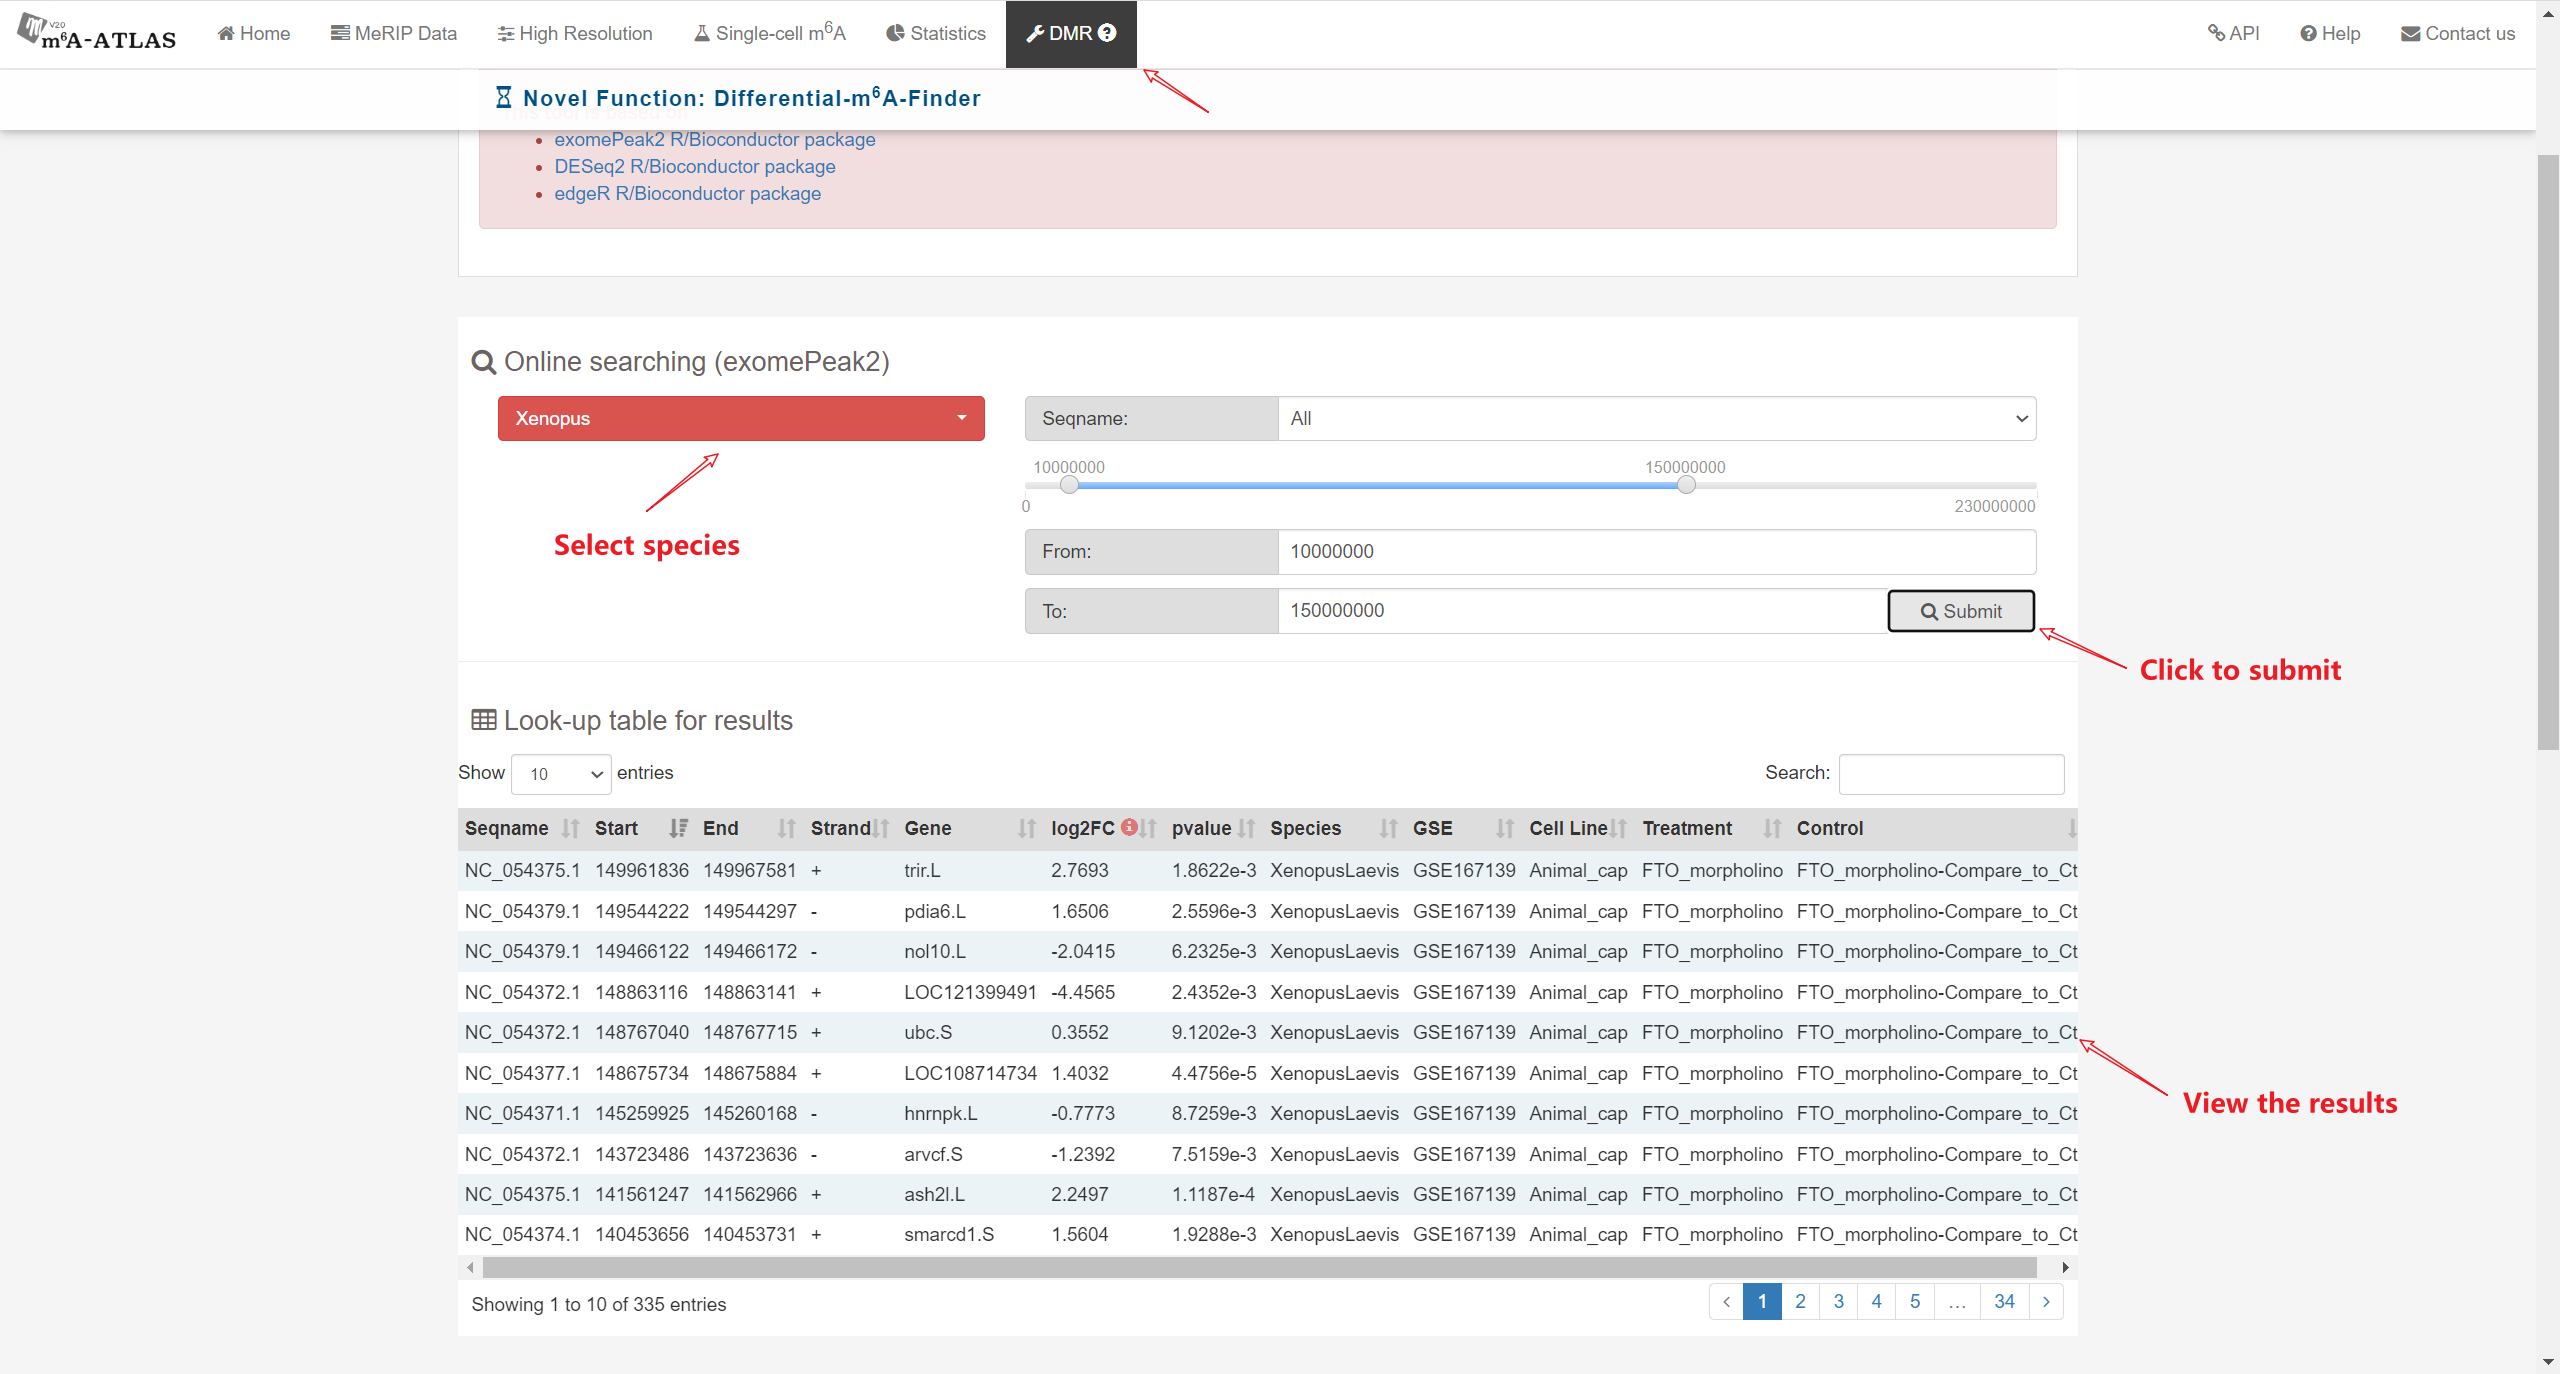
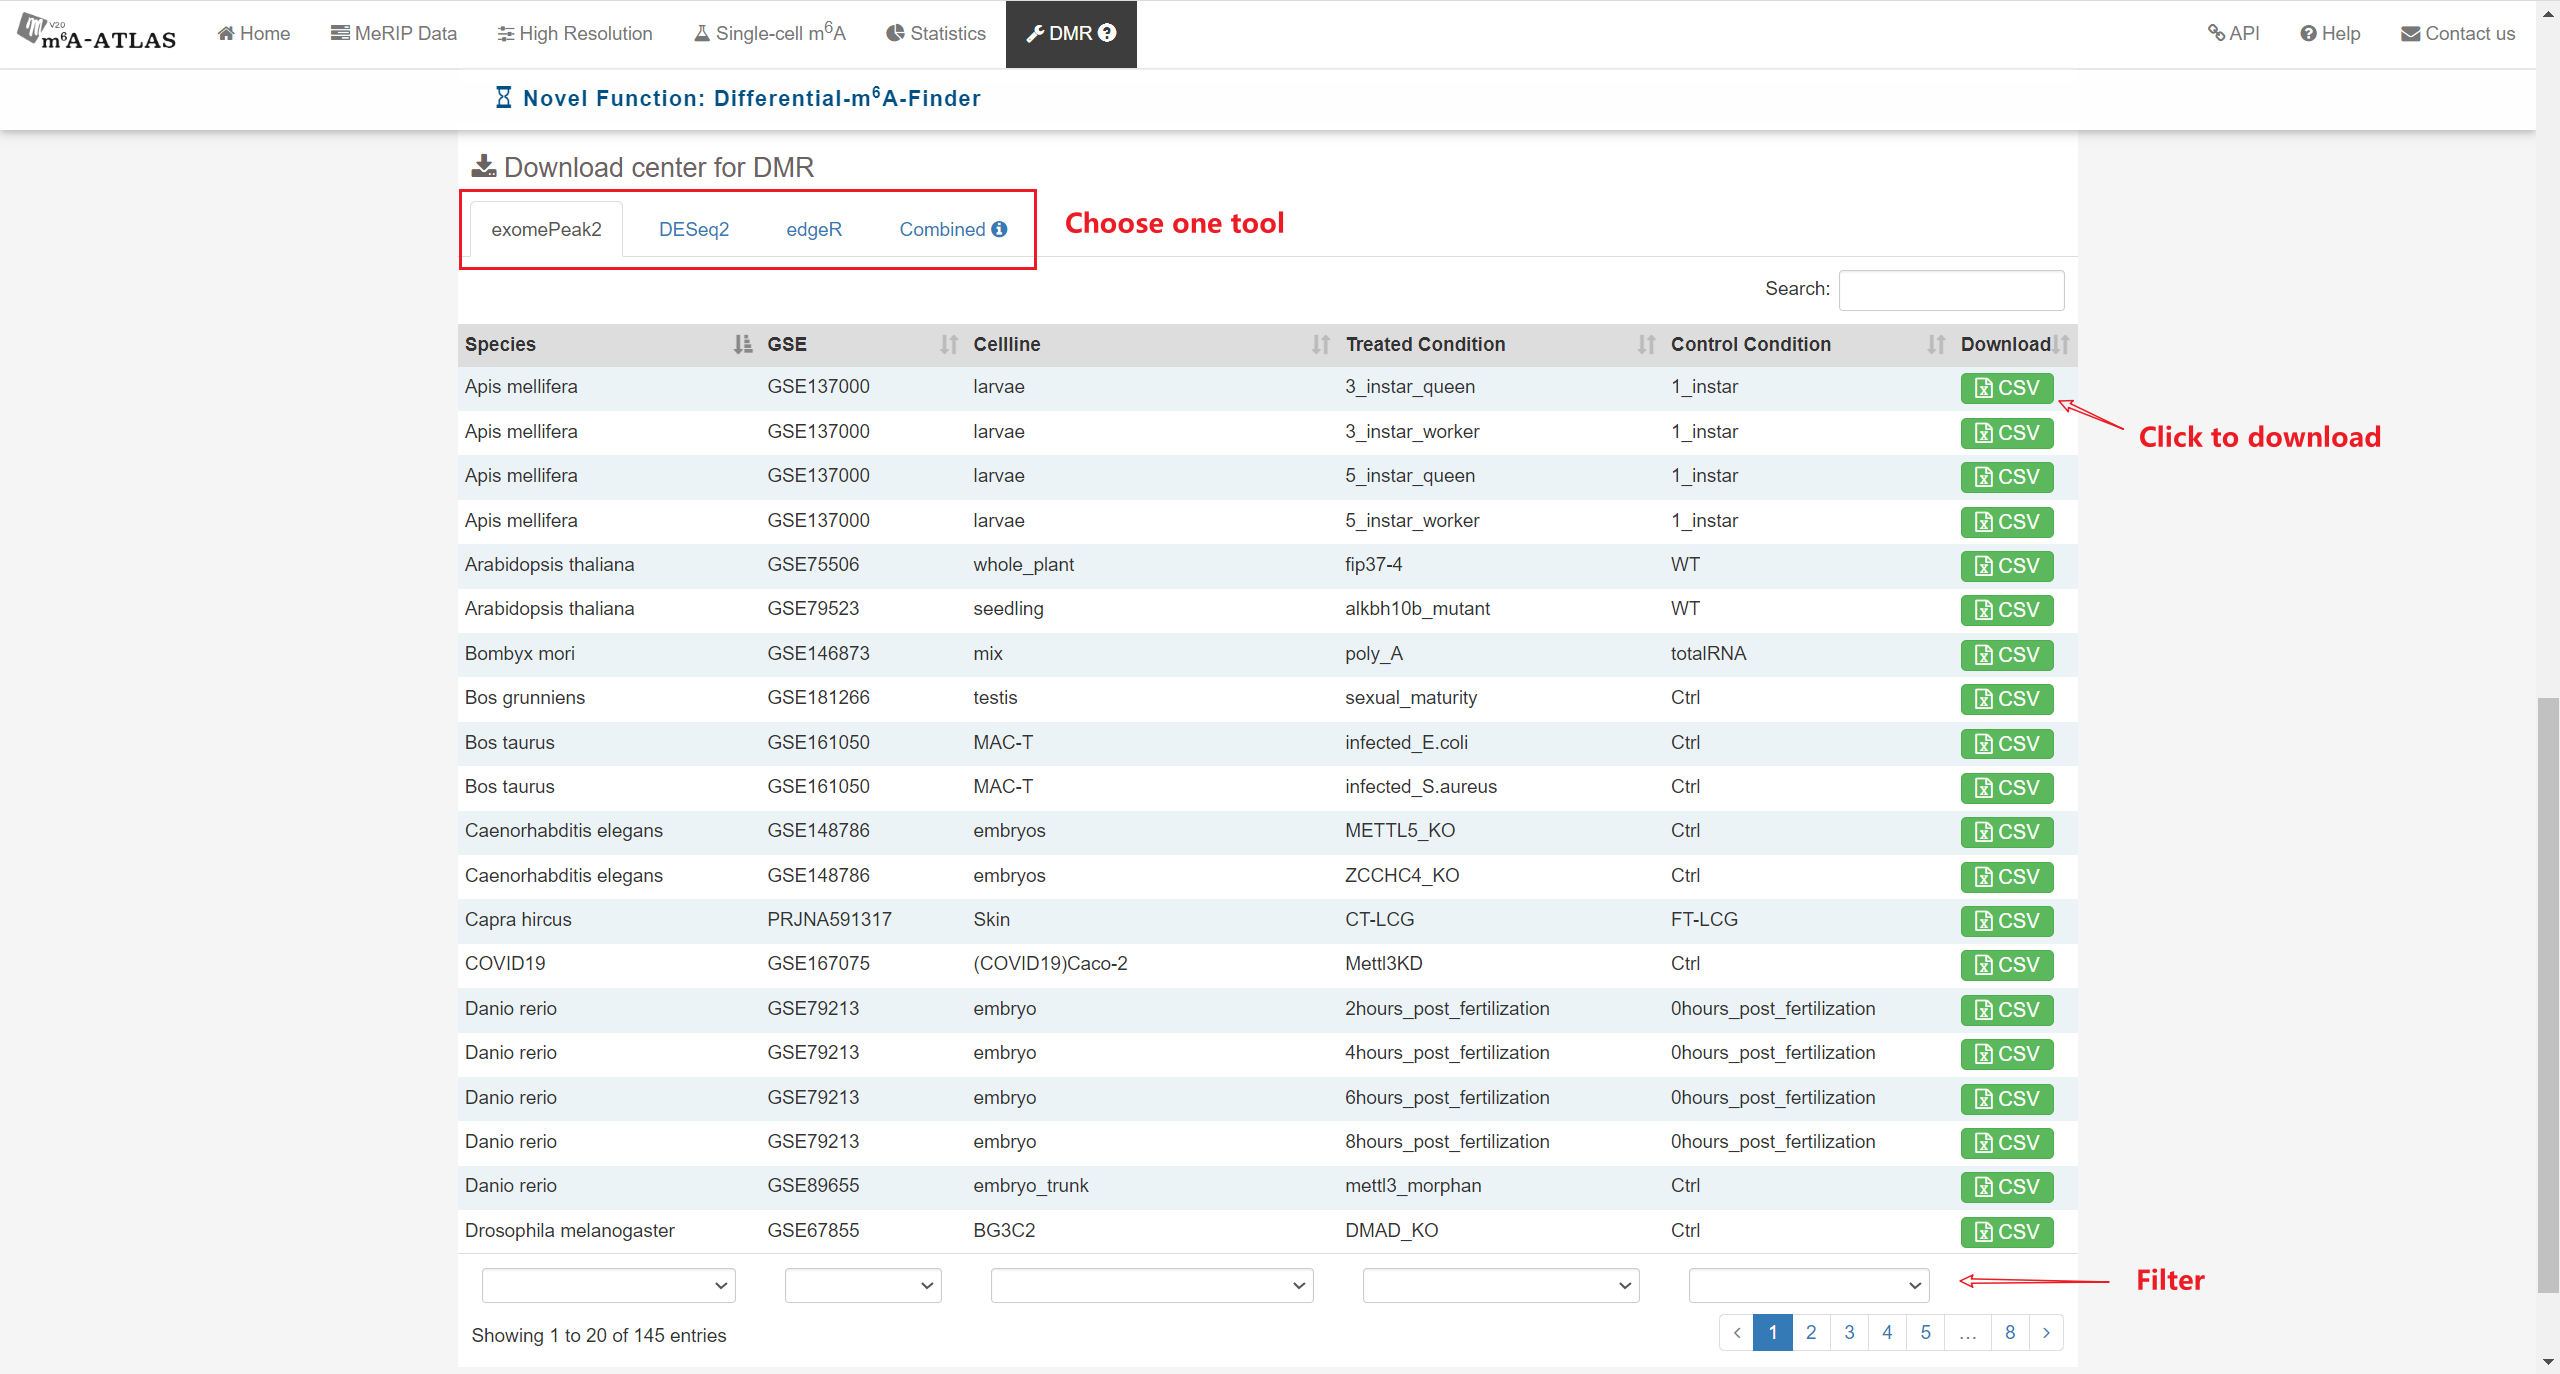
Besides high-resolution data, 16,868,200 m6A enriched regions were recorded in the updated version from 2,712 MeRIP-seq samples. Compared with other RNA modification databases, m6A-Atlas v2.0 covers the most species (30 species and 12 viruses in Atlas v2.0 VS 12 species in RMBase 2.0). We also provide a novel function that enables querying of differentially methylated m6A peaks between different conditions.

Getting Started

We present here m6A-Atlas v2.0, a centralized online platform for a high-confidence collection of unique m6A sites. The m6A-Atlas v2.0 consists of two major components: high-resolution sites and low-resolution peaks.

If you want to know if a gene (or a region) of a certain species has any m6A modifications, you can use the following quick search function on the home page.

1
First, identify the species of interest. Next, make a choice between 'High-Resolution' or 'MeRIP-seq'. Finally, specify the genomic regions and decide on either 'Gene' or 'Region'.
2
Type a gene name or a region range into the search bar

You can type the name of a gene or the range of a region of interest into the search bar. Clicking on the search button brings you to the result page. Please make sure the format of your input is correct. An example is listed below the bar. If nothing is entered into the box, the default value of input will be used.

3
Overview of queried data

This page shows the results under the conditions that you just provided. Pie charts show the percentage of species, cell line, technique and filter. Detailed information is listed in the table, containing the basic site information, conditions of experiments that reported this site, corresponding cell lines and relative techniques, as well as involved RNA binding proteins, miRNA target, splicing site and SNP.

4
Overview of modification sites

You can click "ID" to see more information.

5
Overview of JBrowser results

You can click this 'Visualize in genome browser' button for further information. The JBrowser Genome Browser provides visualization for the m6A sites and other functional features on the genome.

High Resolution Data

m6A-Atlas v2.0 provides users a webpage for a high-confidence collection of reliable m6A sites identified from thirteen base-resolution technologies covering seven eukaryotes. The detailed list of m6A sites, corresponding cell lines and tissues, relative technologies and the statistical results were summarized and presented, according to the needed filter selection of species, cell line, and technique.

1
Click "High Resolution"
2
Select a species
3
Filter

The checkbox on the left lists all relevant cell lines, techniques, and genomic regions for the selected species.
Click to filter cell line(s), technique(s), RBP...

4
View the distribution of filtered data

The pie charts record the distribution of all data under the current filtering conditions.

MeRIP-Seq Data

m6A-Atlas v2.0 provides users a webpage for m6A enriched regions identified from 2,827 MeRIP-seq samples, covering 30 species and 12 viruses.

1
Click "MeRIP Data"
2
Select a species
3
Select an experimental condition
4
View peaks' info

Single-Cell m6A

m6A-Atlas v2.0 provides users a webpage for single-cell m6A profiles for human and mouse which were obtained from scDART-seq and scm6A-seq, respectively.

1
Click "Single-cell m6A"
2
Browse single-cell data

The browsing process for single-cell data is the same as for high resolution data.

DMR (Differential Methylation Regions)

You can download the differential analysis result files of MeRIP-seq data for relevant species in m6A-Atlas v2.0.

1
Search the species & range of interest

Click 'Submit' when the selection is complete.

2
Select the tool of interest

Click the green button to download CSV files.